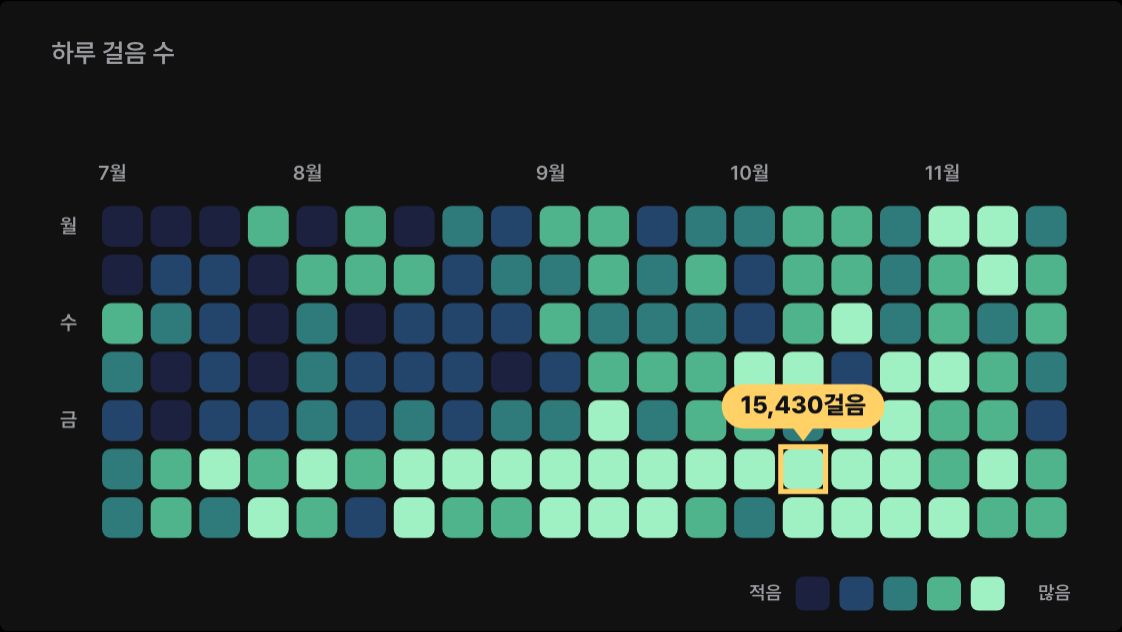
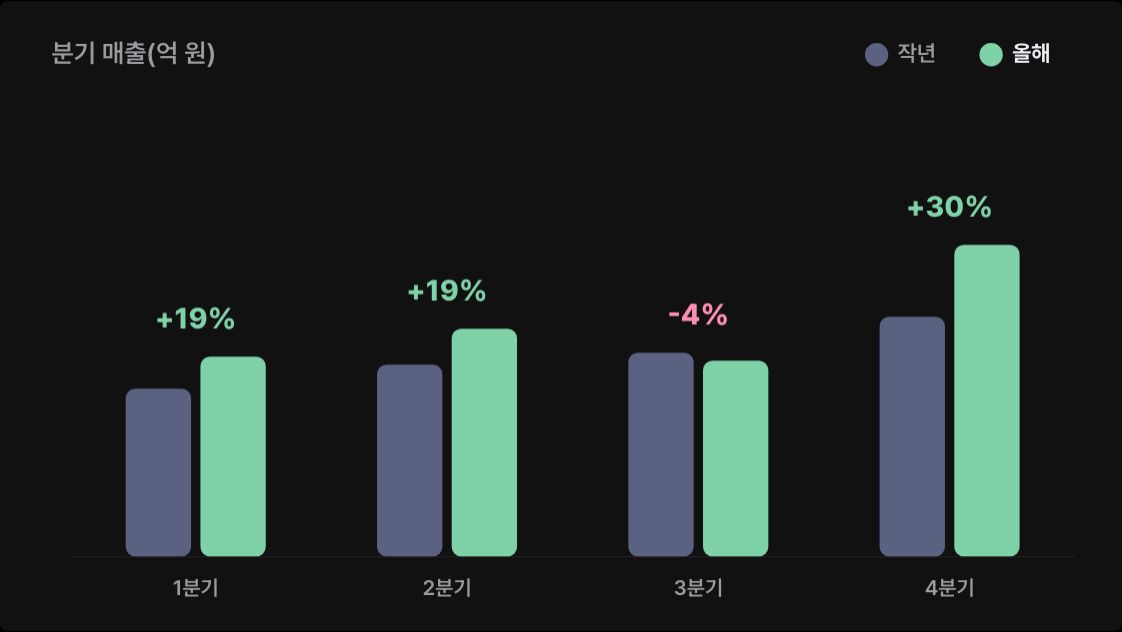
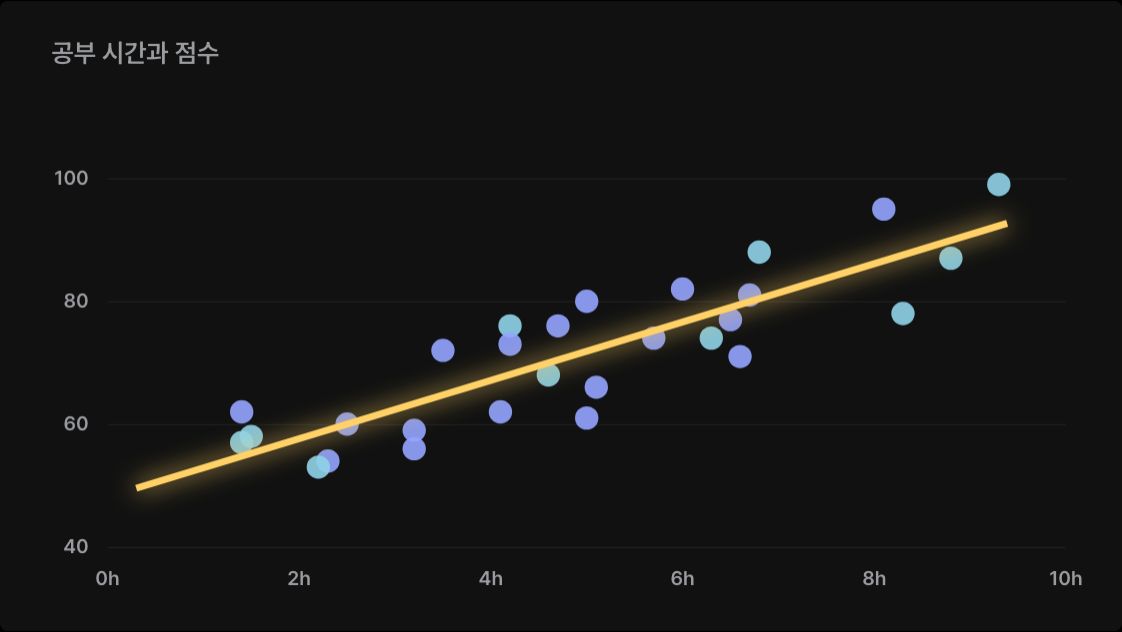
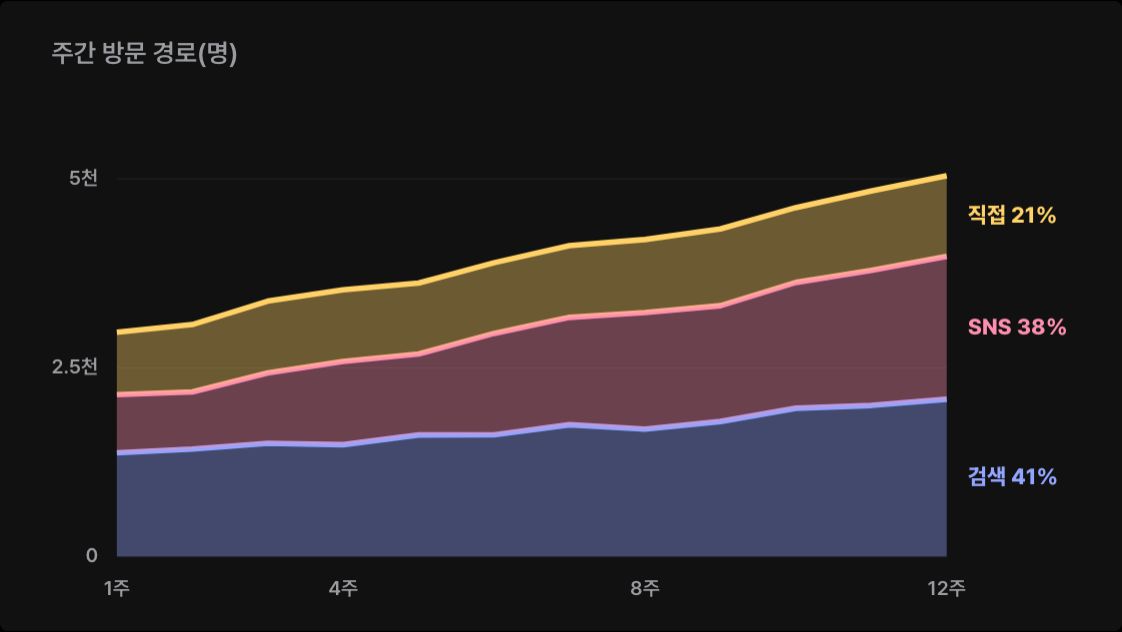
CHT-001
Sparklines in a table
- A small line draws in on each row, with the change in colour.
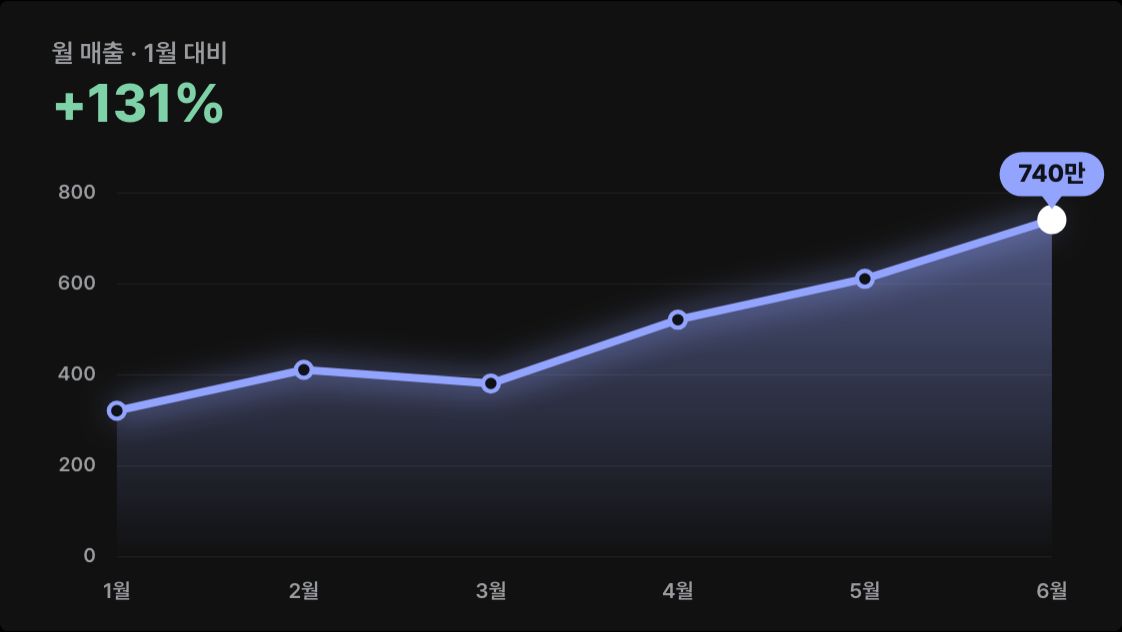
Make a table with one row per product and put a small sparkline of weekly sales in each row. Each row's line draws in slightly later than the one above, and on the right write this week's value and the change from last week as ▲ green or ▼ pink.

[paste your table here]

The first row is the header. Put CSS and JavaScript in a single HTML file and draw with canvas or SVG, without external libraries. Dark background, crisp numbers and text, and no overlapping text even at phone width. If prefers-reduced-motion is on, show the finished chart without motion.
상품마다 한 줄인 표를 만들고, 줄마다 주별 판매량 추세선을 작게 넣어 주세요. 추세선은 줄마다 조금씩 늦게 그어지고, 오른쪽에 이번 주 값과 지난주 대비 증감을 ▲ 초록, ▼ 분홍으로 적어요.
[여기에 표 붙여넣기]
첫 줄은 머리글이에요. HTML 파일 하나에 CSS와 JavaScript를 넣고, 외부 라이브러리 없이 canvas나 SVG로 그려 주세요. 어두운 배경에 숫자와 글자는 또렷하게, 휴대폰 폭에서도 글자가 겹치지 않게 해 주세요. prefers-reduced-motion이 켜져 있으면 움직임 없이 다 그려진 차트를 보여 주세요.Blanks
How to use
- Borrow (copy) the prompt.
- Replace the [brackets] with your own content. Type in the fields below and it updates at once.
- Paste it into a new Claude chat and open the HTML file it returns in a browser.
Process
- A scene from the guide "Animated data charts with Claude".
- The preview is drawn on this site to show the scene this prompt makes.