CHT-006
Calendar heatmap
- Cells, one week per column, pop in like a wave.
Draw daily values as a calendar heatmap with one week per column. Cells pop in like a wave starting from the leftmost week, and larger values are a deeper [colour]. Give the largest day an outline and its value, with month names on top and weekdays on the left.

[paste your table here]

The first row is the header. Put CSS and JavaScript in a single HTML file and draw with canvas or SVG, without external libraries. Dark background, crisp numbers and text, and no overlapping text even at phone width. If prefers-reduced-motion is on, show the finished chart without motion.
날짜별 값을 한 주가 한 칸 열인 달력 히트맵으로 그려 주세요. 칸은 왼쪽 주부터 물결처럼 튀어나오며 채워지고, 값이 클수록 진한 [색]이에요. 가장 큰 날에는 테두리와 값을 달고, 위에 달 이름, 왼쪽에 요일을 적어요.
[여기에 표 붙여넣기]
첫 줄은 머리글이에요. HTML 파일 하나에 CSS와 JavaScript를 넣고, 외부 라이브러리 없이 canvas나 SVG로 그려 주세요. 어두운 배경에 숫자와 글자는 또렷하게, 휴대폰 폭에서도 글자가 겹치지 않게 해 주세요. prefers-reduced-motion이 켜져 있으면 움직임 없이 다 그려진 차트를 보여 주세요.Blanks
How to use
- Borrow (copy) the prompt.
- Replace the [brackets] with your own content. Type in the fields below and it updates at once.
- Paste it into a new Claude chat and open the HTML file it returns in a browser.
Process
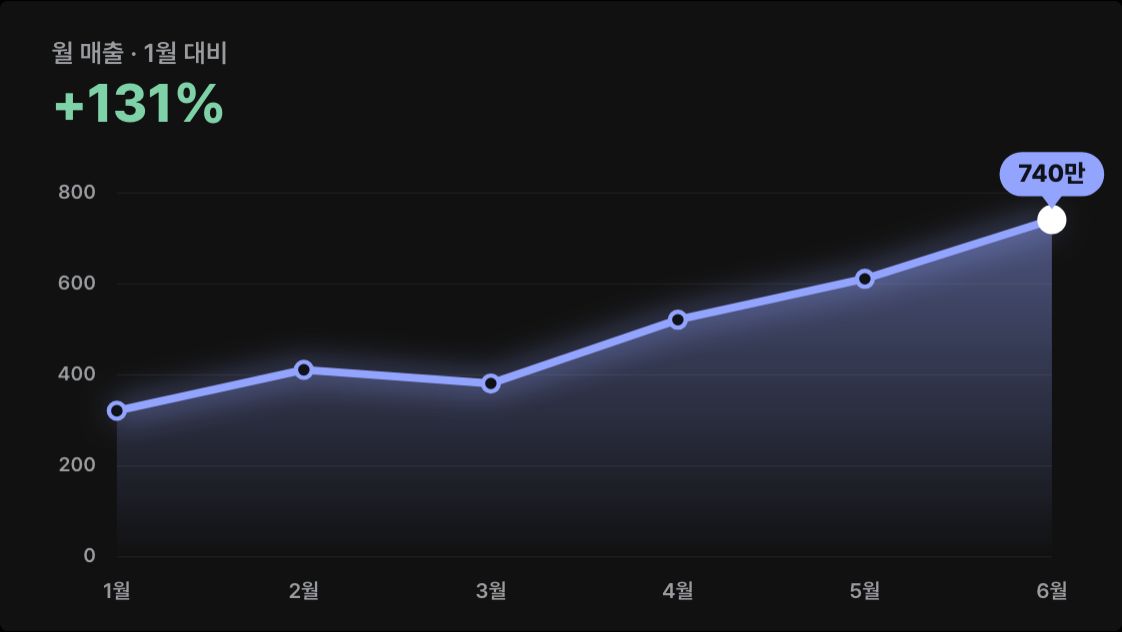
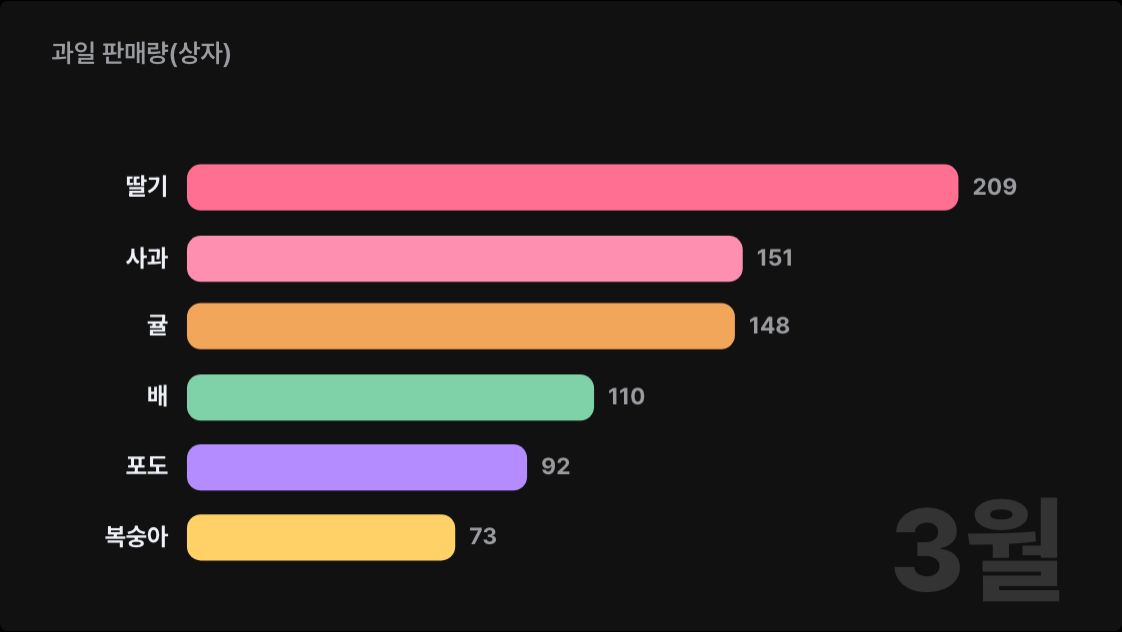
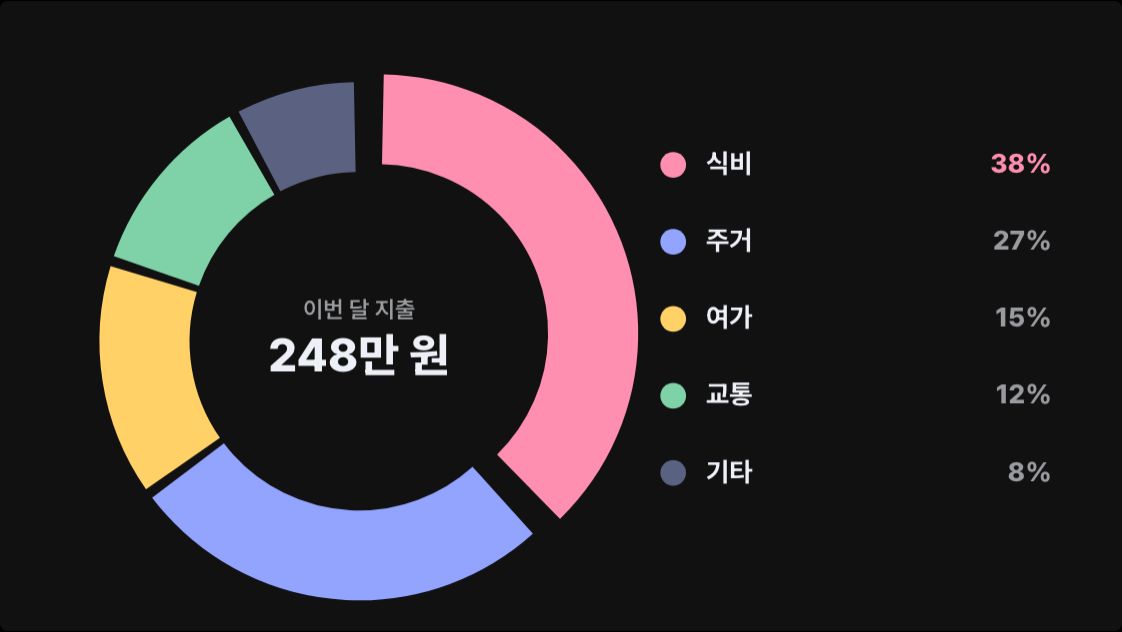
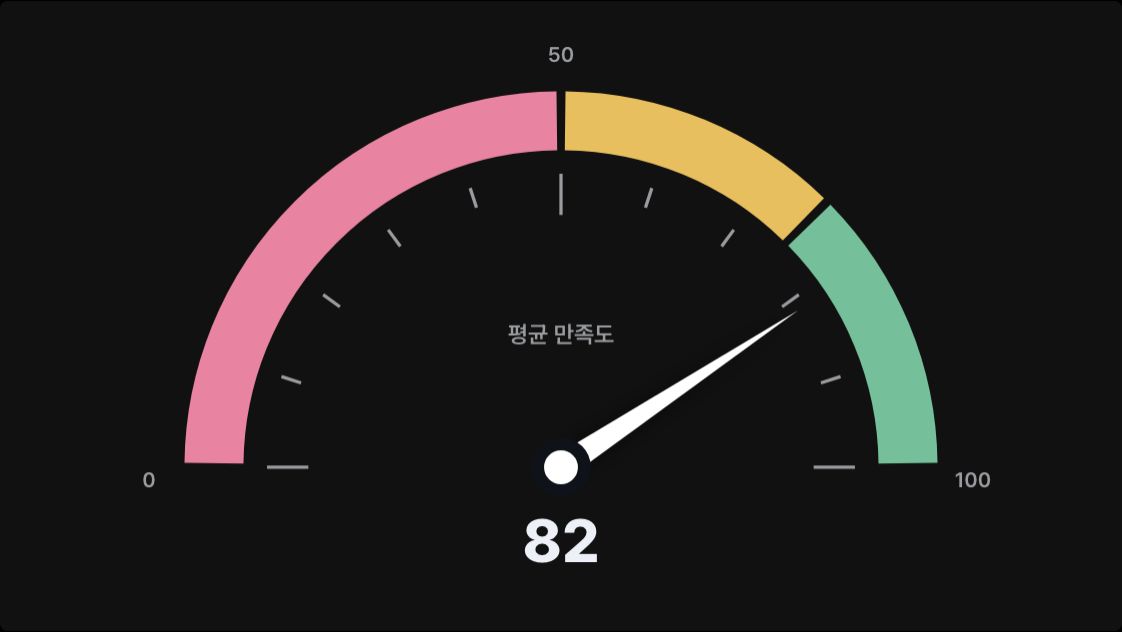
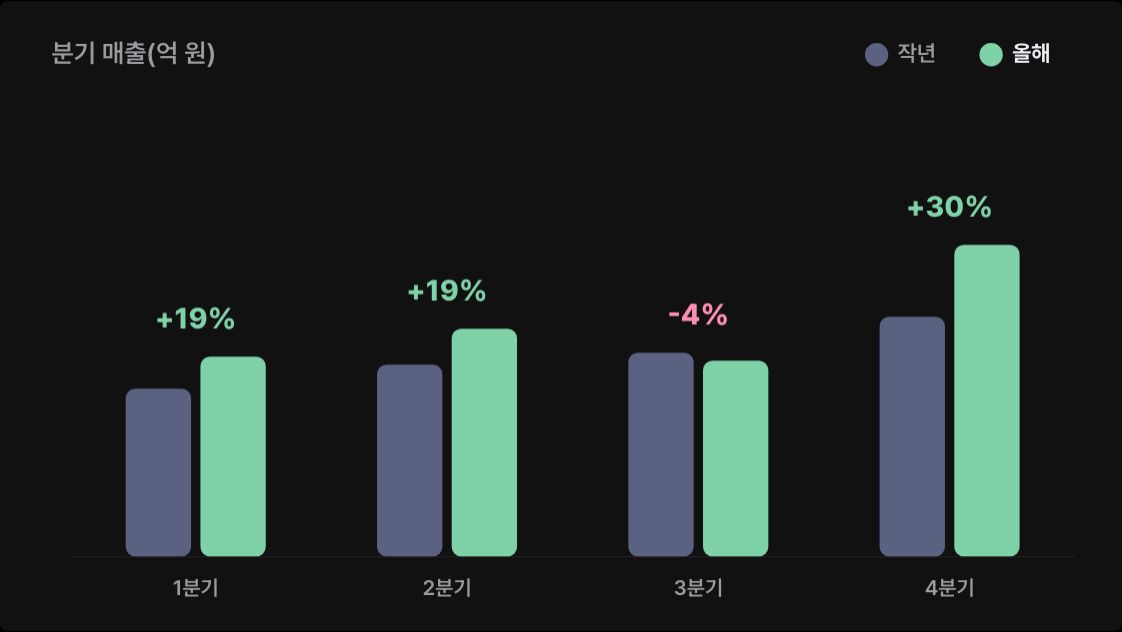
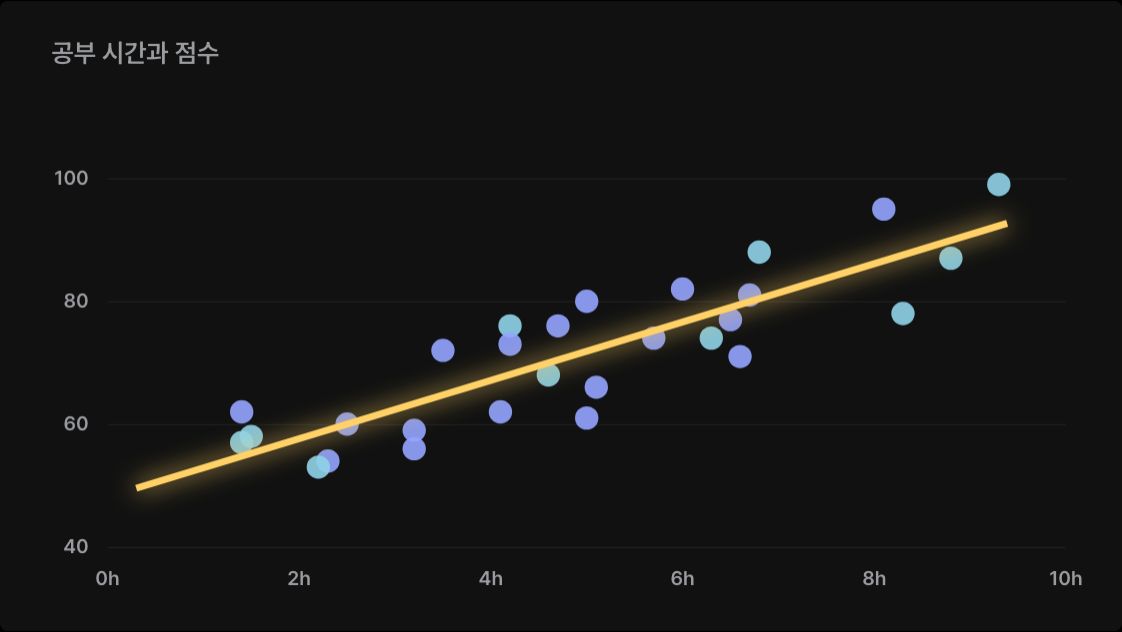
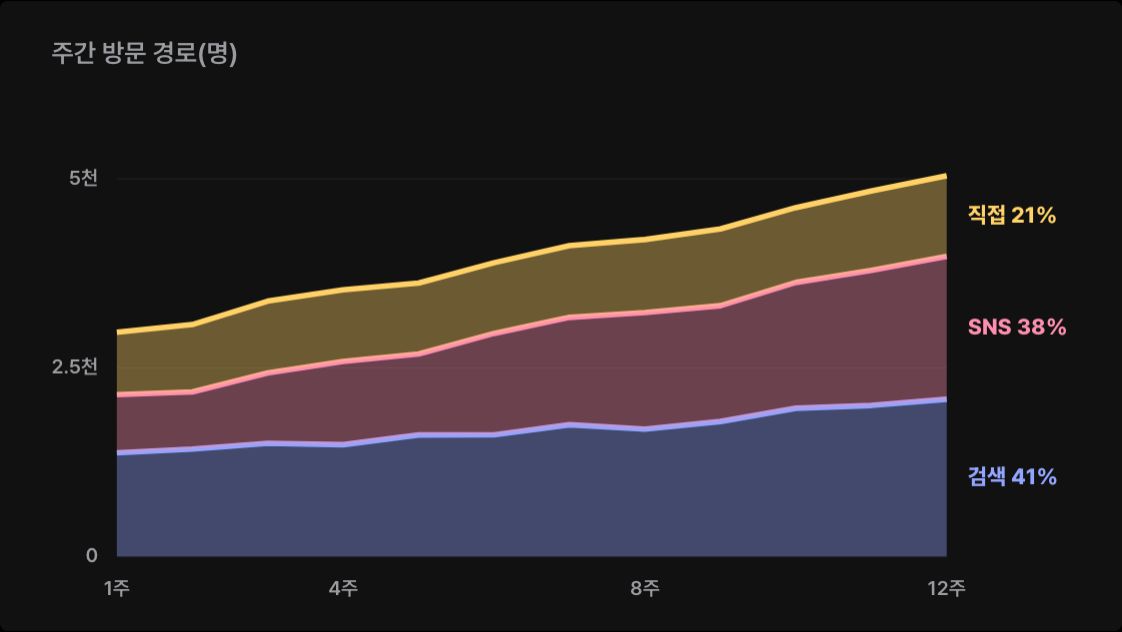
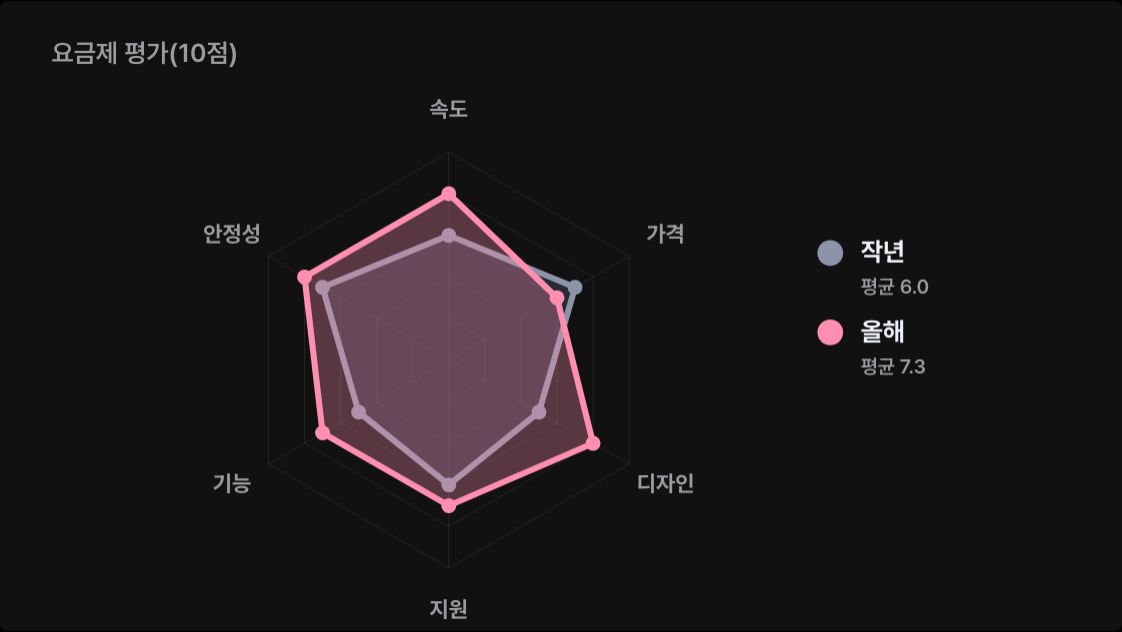
- A scene from the guide "Animated data charts with Claude".
- The preview is drawn on this site to show the scene this prompt makes.