CHT-004
Scatter with trend line
- Dots float up into place, then a trend line draws in and states the slope.
Plot the relationship between two columns as a scatter chart. Dots float up from the bottom one after another and settle, then a least-squares trend line draws in from the left. Write the slope at the end of the line in the form "+n for each 1 increase in x".

[paste your table here]

The first row is the header. Put CSS and JavaScript in a single HTML file and draw with canvas or SVG, without external libraries. Dark background, crisp numbers and text, and no overlapping text even at phone width. If prefers-reduced-motion is on, show the finished chart without motion.
두 열의 관계를 점 그래프로 그려 주세요. 점은 아래에서 차례로 떠올라 자리 잡고, 그다음 최소제곱 추세선이 왼쪽부터 그어져요. 추세선 끝에 "x가 1 늘 때 +몇" 형식으로 기울기를 적어 주세요.
[여기에 표 붙여넣기]
첫 줄은 머리글이에요. HTML 파일 하나에 CSS와 JavaScript를 넣고, 외부 라이브러리 없이 canvas나 SVG로 그려 주세요. 어두운 배경에 숫자와 글자는 또렷하게, 휴대폰 폭에서도 글자가 겹치지 않게 해 주세요. prefers-reduced-motion이 켜져 있으면 움직임 없이 다 그려진 차트를 보여 주세요.Blanks
How to use
- Borrow (copy) the prompt.
- Replace the [brackets] with your own content. Type in the fields below and it updates at once.
- Paste it into a new Claude chat and open the HTML file it returns in a browser.
Process
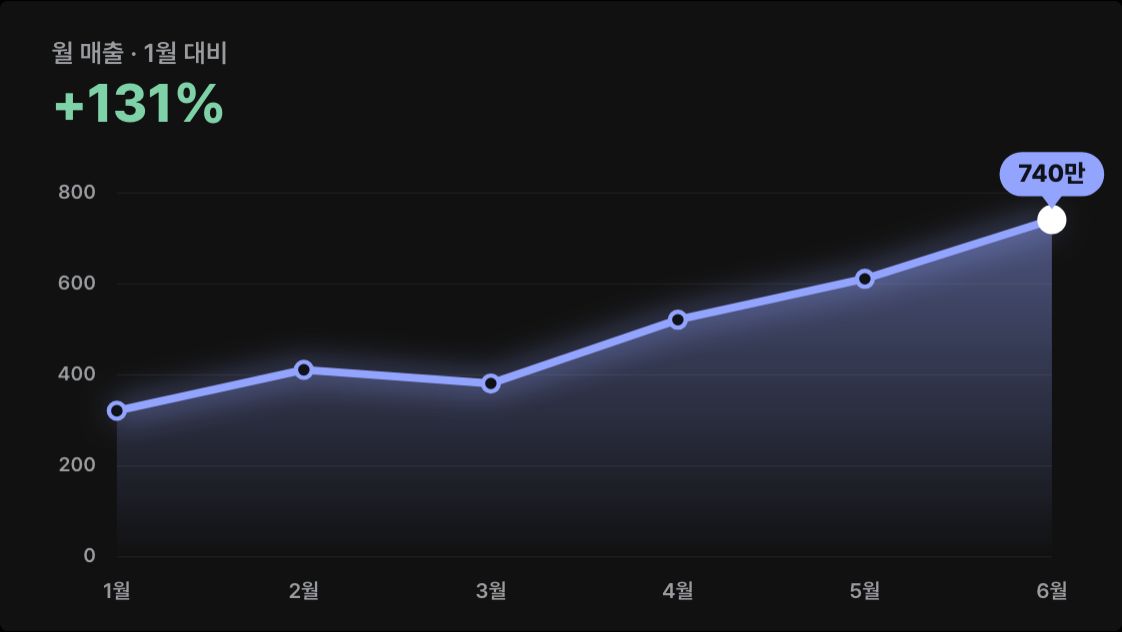
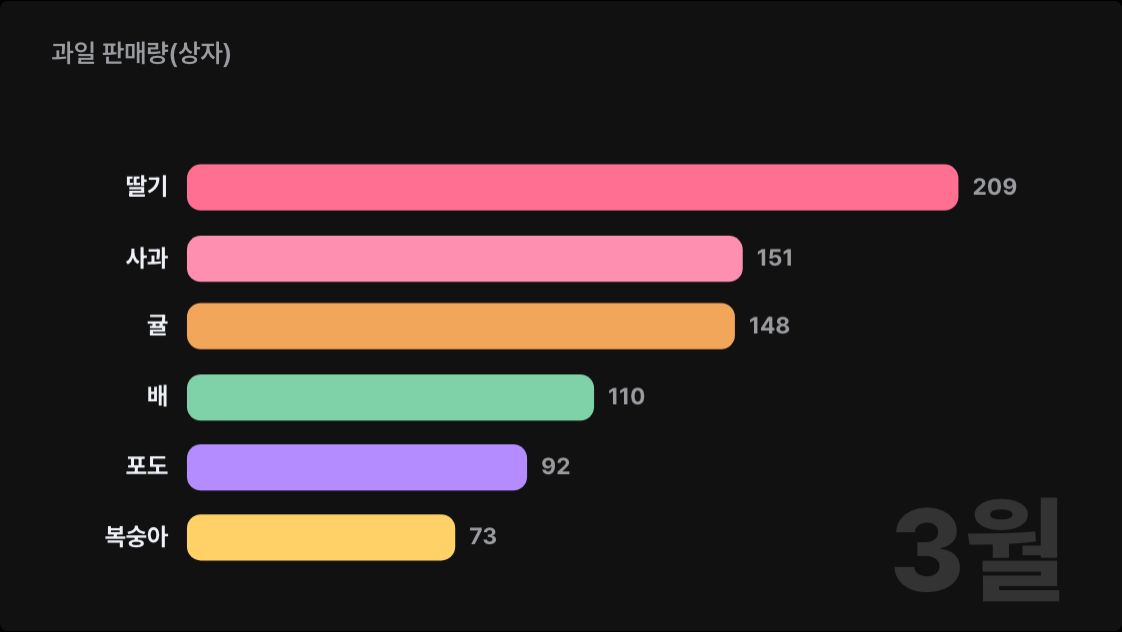
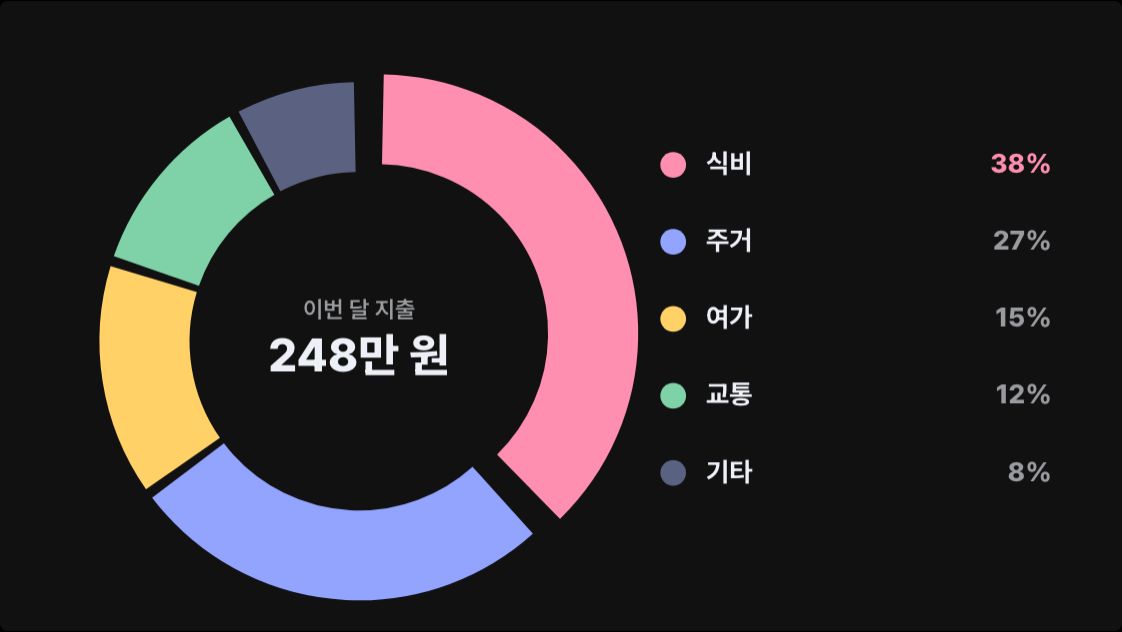
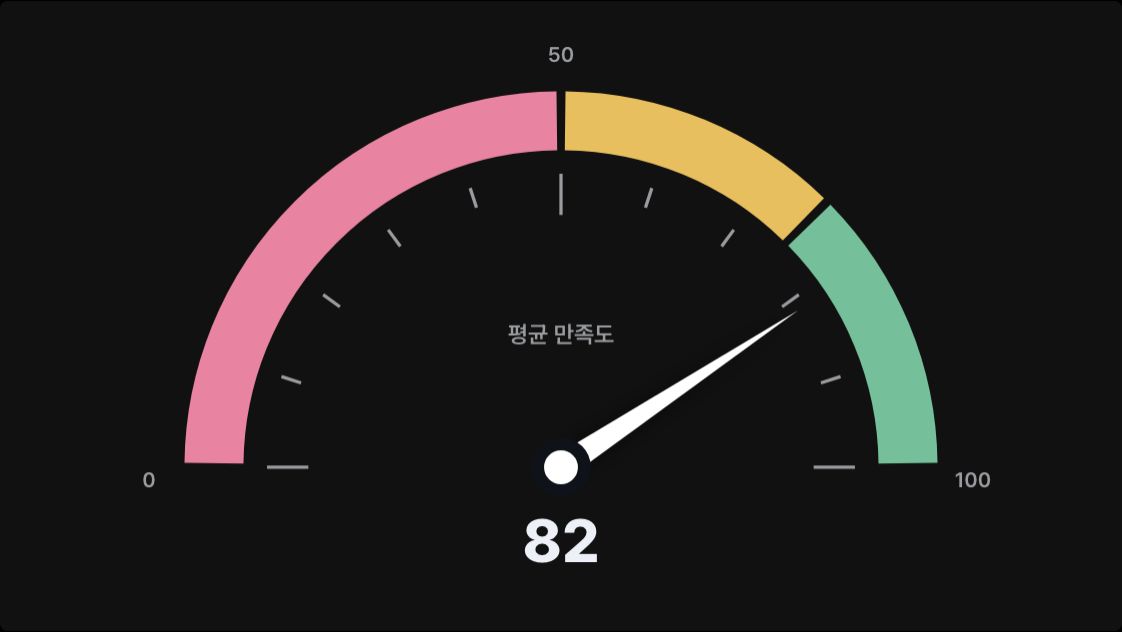
- A scene from the guide "Animated data charts with Claude".
- The preview is drawn on this site to show the scene this prompt makes.